Toolkit LTTB Tutorial
Largest Triangle Three Buckets is a downsampling method that tries to retain visual similarity between the downsampled data and the original dataset.
While most frameworks implement it in the front end, TimescaleDB Toolkit provides an implementation that takes (timestamp, value) pairs, sorts them if needed, and downsamples the values directly in the database.
In the following steps, you'll learn how to use LTTB from both databases and the Ruby programming language—writing the LTTB algorithm in Ruby from scratch—fully comprehend how it works and later compares the performance and usability of both solutions.
Later, we'll benchmark the downsampling methods and the plain data using a real scenario. The data points are actual data from the weather dataset.
If you want to run it yourself, feel free to use the example that contains all the steps we will describe here.
Setup the dependencies
Bundler inline avoids the creation of the Gemfile to prototype code that you can ship in a single file. You can declare all the gems in the gemfile code block, and Bundler will install them dynamically.
require 'bundler/inline'

gemfile(true) do
  gem 'timescaledb'
  gem 'pry'
  gem 'chartkick'
  gem 'sinatra'
end
The Timescale gem doesn't require the toolkit by default, so you must specify it to use.
Warning
Note that we do not require the rest of the libraries because Bundler inline already requires the specified libraries by default which is very convenient for examples in a single file.
Let's take a look at what dependencies we have for what purpose:
- timescaledb gem is the ActiveRecord wrapper for TimescaleDB functions.
- pry is here because it's the best REPL to debug any Ruby code. We add it in the end to ease the exploring session you can do yourself after learning with the tutorial.
- chartkick is the library that can plot the values and make it easy to plot the data results.
- sinatra is a DSL for quickly creating web applications with minimal effort.
Setup database
Now, it's time to set up the database for this application. Make sure you have TimescaleDB installed or learn how to install TimescaleDB here.
Establishing the connection
The next step is to connect to the database so that we will run this example with the PostgreSQL URI as the last argument of the command line.
If this line works, it means your connection is good.
Downloading the dataset
The weather dataset is available here, and here is small automation to make it run smoothly with small, medium, and big data sets.
VALID_SIZES = %i[small med big]
def download_weather_dataset size: :small
  unless VALID_SIZES.include?(size)
    fail "Invalid size: #{size}. Valid are #{VALID_SIZES}"
  end
  url = "https://timescaledata.blob.core.windows.net/datasets/weather_#{size}.tar.gz"
  puts "fetching #{size} weather dataset..."
  system "wget \"#{url}\""
  puts "done!"
end
Now, let's create a setup method to verify if the database is created and have the data loaded, and fetch it if necessary.
def setup size: :small
  file = "weather_#{size}.tar.gz"
  download_weather_dataset unless File.exists? file
  puts "extracting #{file}"
  system "tar -xvzf #{file} "
  puts "creating data structures"
  system "psql #{PG_URI} < weather.sql"
  system %|psql #{PG_URI} -c "\\COPY locations FROM weather_#{size}_locations.csv CSV"|
  system %|psql #{PG_URI} -c "\\COPY conditions FROM weather_#{size}_conditions.csv CSV"|
end
Info
Maybe you'll need to recreate the database if you want to test with a different dataset.
Declaring the models
Now, let's declare the ActiveRecord models. The location is an auxiliary table to control the placement of the device.
class Location < ActiveRecord::Base
  self.primary_key = "device_id"

  has_many :conditions, foreign_key: "device_id"
end
Every location emits weather conditions with temperature and humidity every X minutes.
The conditions is the time-series data we'll refer to here.
class Condition < ActiveRecord::Base
  acts_as_hypertable time_column: "time"
  acts_as_time_vector value_column: "temperature", segment_by: "device_id"
  belongs_to :location, foreign_key: "device_id"
end
Putting all together
Now it's time to call the methods we implemented before. So, let's set up a logger to STDOUT to confirm the steps and add the toolkit to the search path.
Similar to database migration, we need to verify if the table exists, set up the hypertable and load the data if necessary.
ActiveRecord::Base.connection.instance_exec do
  ActiveRecord::Base.logger = Logger.new(STDOUT)
  add_toolkit_to_search_path!

  unless Condition.table_exists?
    setup size: :small
  end
end
The setup method also can fetch different datasets and you'll need to manually
drop the conditions and locations tables to reload it.
Info
If you want to go deeper and reload everything every time, feel free to
add the following lines before the unless block:
Let's keep the example simple to run it manually and drop the tables when we want to run everything from scratch.
Processing LTTB in Ruby
You can find an old lttb gem available if you want to cut down this step but this library is not fully implementing the lttb algorithm, and the results may differ from the Timescale implementation.
If you want to understand the algorithm behind the scenes, this step will make it very clear and easy to digest. You can also preview the original lttb here.
Info
The original thesis describes lttb as:
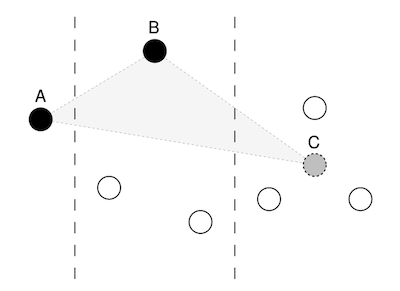
The algorithm works with three buckets at a time and proceeds from left to right. The first point which forms the left corner of the triangle (the effective area) is always fixed as the point that was previously selected and one of the points in the middle bucket shall be selected now. The question is what point should the algorithm use in the last bucket to form the triangle."
The obvious answer is to use a brute-force approach and simply try out all the possibilities. That is, for each point in the current bucket, form a triangle with all the points in the next bucket. It turns out that this gives a fairly good visual result, but as with many brute-force approaches it is inefficient. For example, if there were 100 points per bucket, the algorithm would need to calculate the area of 10,000 triangles for every bucket. Another and more clever solution is to add a temporary point to the last bucket and keep it fixed. That way the algorithm has two fixed points; and one only needs to calculate the number of triangles equal to the number of points in the current bucket. The point in the current bucket which forms the largest triangle with this two fixed point in the adjacent buckets is then selected. In figure 4.4 it is shown how point B forms the largest triangle across the buckets with fixed point A (previously selected) and the temporary point C.
Calculate the area of a Triangle
To demonstrate the same, let's create a module Triangle with an area method that accepts three points a',b, andc, which will be pairs ofxandy' cartesian coordinates.
module Triangle
  module_function
  def area(a, b, c)
    (ax, ay), (bx, by), (cx, cy) = a,b,c
    (
      (ax - cx).to_f * (by - ay) -
      (ax - bx).to_f * (cy - ay)
    ).abs * 0.5
  end
end
Info
In this implementation, we're using the shoelace method.
The shoelace method (also known as Gauss's area formula and the surveyor's formula) is a mathematical algorithm to determine the area of a simple polygon whose vertices are described by their Cartesian coordinates in the plane. It is called the shoelace formula because of the constant cross-multiplying for the coordinates making up the polygon, like threading shoelaces. It has applications in surveying and forestry, among other areas. Source: Shoelace formula Wikipedia
Initializing the Lttb class
The lttb class will be responsible for processing the data and downsampling the points to the desired threshold. Let's declare the initial boilerplate code with some basic validation to make it work.
class Lttb
  attr_reader :data, :threshold
  def initialize(data, threshold)
    fail 'data is not an array unless data.is_a? Array
    fail "threshold should be >= 2. It's #{threshold}." if threshold < 2
    @data = data
    @threshold = threshold
  end
  def downsample
    fail 'Not implemented yet!'
  end
end
Note that the threshold considers at least 3 points as the edges should keep untouched, and the algorithm will reduce only the points in the middle.
Calculating the average of points
Combining all possible points to check the largest area would become very hard for performance reasons. For this case, we need to have an average method. The average between the points will become the temporary point as the previous documentation described:
> _For example, if there were 100 points per bucket, the algorithm would need to calculate the area of 10,000 triangles for every bucket. Another clever solution is to add a temporary point to the last bucket and keep it fixed. That way, the algorithm has two fixed points;_
We'll need to establish the interface we want for our Lttb class. Let's say we want to test it with some static data like:
data = [
  ['2020-1-1', 10],
  ['2020-1-2', 21],
  ['2020-1-3', 19],
  ['2020-1-4', 32],
  ['2020-1-5', 12],
  ['2020-1-6', 14],
  ['2020-1-7', 18],
  ['2020-1-8', 29],
  ['2020-1-9', 23],
  ['2020-1-10', 27],
  ['2020-1-11', 14]]

data.each do |e|
  e[0] = Time.mktime(*e[0].split('-'))
end
Downsampling the data which have 11 points to 5 points in a single line, we'd need a method like:
Let's wrap the static method that will be necessary to wrap the algorithm:
Info
Note that the example is reopening the class several times to accomplish it. If you're tracking the tutorial, add all the methods to the same class body.
Now, it's time to add the class initializer and the instance readers, with some minimal validation of the arguments:
class Lttb
  attr_reader :data, :threshold
  def initialize(data, threshold)
    fail 'data is not an array unless data.is_a? Array
    fail "threshold should be >= 2. It's #{threshold}." if threshold < 2
    @data = data
    @threshold = threshold
  end

  def downsample
    fail 'Not implemented yet!'
  end
end
The downsample method is failing because it's the next step to building the logic behind it.
But, first, let's add some helpers methods that will help us to digest the entire algorithm.
Dates versus Numbers
We're talking about time-series data, and we'll need to normalize them to numbers.
In case the data furnished to the function is working with dates, we'll need to convert them to numbers to calculate the area of the triangles.
Considering the data is already sorted by time, the strategy here will be to save the first date and iterate under all records transforming dates into numbers relative to the first date in the data.
To convert the downsampled data, we need to sum the interval to the start date.
Bucket size
Now, it's time to define how many points should be analyzed per time to downsample the data. As the first and last points should remain untouched, the algorithm should reduce the remaining points in the middle based on a ratio between the total amount of data and the threshold.
Bucket size is a float number, and array slices will need to have an integer to slice many elements to calculate the triangle areas.
Downsampling
Let's put it all together and create the core structure to iterate over the values and process the triangles to select the most extensive areas.
  def downsample
    unless @data.first.first.is_a?(Numeric)
      transformed_dates = true
      dates_to_numbers()
    end
    downsampled = process
    numbers_to_dates(downsampled) if transformed_dates
    downsampled
  end
The last method is the process that should contain all the logic.
It navigates the points and downsamples the coordinates based on the threshold.
  def process
    return data if threshold >= data.size

    sampled = [data.first]
    point_index = 0

    (threshold - 2).times do |i|
      step = [((i+1.0) * bucket_size).to_i, data.size - 1].min
      next_point = (i * bucket_size).to_i  + 1

      break if next_point > data.size - 2

      points = data[step, slice]
      avg_x = Lttb.avg(points.map(&:first)).to_i
      avg_y = Lttb.avg(points.map(&:last))

      max_area = -1.0

      (next_point...(step + 1)).each do |idx|
        area = Triangle.area(data[point_index], data[idx], [avg_x, avg_y])

        if area > max_area
          max_area = area
          next_point = idx
        end
      end

      sampled << data[next_point])
      point_index = next_point
    end

    sampled << data.last
  end
For example, to downsample 11 points to 5, it will take the first and the eleventh into sampled data and add three more points in the middle. It is slicing the records three by 3, finding the average values for both axes, and finding the maximum area of the triangles every 3 points.
Web preview
Now, it's time to preview and check the functions in action. Plotting the downsampled data in the browser.
Let's jump into the creation of some helpers that the frontend will use in both endpoints for Ruby and SQL:
def conditions
   Location
     .find_by(device_id: 'weather-pro-000001')
     .conditions
end

def threshold
  params[:threshold]&.to_i || 20
end
Now, defining the routes we have:
Main preview
And the views/index.erb is:
<script src="https://cdn.jsdelivr.net/npm/jquery@3.6.1/dist/jquery.min.js"></script>
<script src="https://cdn.jsdelivr.net/npm/hammerjs@2.0.8hammerjs@2.0.8"></script>
<script src="https://cdn.jsdelivr.net/npm/moment@2.29.4/moment.min.js"></script>
<script src="https://cdn.jsdelivr.net/npm/highcharts@10.2.1/highcharts.min.js"></script>
<script src="https://cdn.jsdelivr.net/npm/chartjs-adapter-moment@1.0.0/dist/chartjs-adapter-moment.min.js"></script>
<script src="https://cdn.jsdelivr.net/npm/chartkick@4.2.0/dist/chartkick.min.js"></script>
<script src="https://cdn.jsdelivr.net/npm/chartjs-plugin-zoom@1.2.1/dist/chartjs-plugin-zoom.min.js"></script>
As it's a development playground, so can also add information about how many records are available in the scope and allow the end user to interactively change the threshold to check different ratios.
<h3>Downsampling <%= conditions.count %> records to
  <select value="<%= threshold %>" onchange="location.href=`/?threshold=${this.value}`">
    <option><%= threshold %></option>
    <option value="50">50</option>
    <option value="100">100</option>
    <option value="500">500</option>
    <option value="1000">1000</option>
    <option value="5000">5000</option>
  </select> points.
</h3>
The ruby endpoint
The /lttb_ruby is the endpoint to return the Ruby processed lttb data.
get '/lttb_ruby' do
  data = conditions.pluck(:time, :temperature)
  downsampled = Lttb.downsample(data, threshold)
  json [{name: "Ruby", data: downsampled }]
end
Info
Note that we're using the pluck method to fetch only an array with the data and avoid object mapping between SQL and Ruby. This is the most performant way to bring a subset of columns.
The SQL endpoint
The /lttb_sql as the endpoint to return the lttb processed from Timescale.
get "/lttb_sql" do
  lttb_query = conditions
    .select("toolkit_experimental.lttb(time, temperature,#{threshold})")
    .to_sql
  downsampled = Condition.select('time, value as temperature')
    .from("toolkit_experimental.unnest((#{lttb_query}))")
    .map{|e|[e['time'],e['temperature']]}
  json [{name: "LTTB SQL", data: downsampled, time: @time_sql}]
end
Benchmarking
Now that both endpoints are ready, it's easy to check the results and understand how fast Ruby can execute each solution.

In the logs, we can see the time difference between every result:
"GET /lttb_sql?threshold=127 HTTP/1.1" 200 4904 0.6910
"GET /lttb_ruby?threshold=127 HTTP/1.1" 200 5501 7.0419
Note that the last two values of each line are the request's total bytes and the endpoint processing time.
SQL processing took 0.6910 while Ruby took 7.0419 seconds which is ten times slower than SQL.
Now, the last comparison is in the data size if we send all data to the view to process in the front end.
get '/all_data' do
  data = conditions.pluck(:time, :temperature)
  json [ { name: "All data", data: data} ]
end
And in the index.erb file, we have the data. The new line in the logs for all_data is:
As you can see, the last two values are the bytes and the time. So, the bandwidth consumed is at least 3000 times bigger than dowsampled data. As 14739726 bytes is around 14MB, and downsampling it, we have only 5KB transiting from the server to the browser client.
Downsampling it in the front end would save bandwidth from your server and memory and process consumption in the front end. It will also render the application faster and make it usable.
Try it yourself!
You can still run this code from the official repository if you haven't followed the step-by-step tutorial. Check this out:
git clone https://github.com/jonatas/timescaledb.git
cd timescaledb
bundle install
cd examples/toolkit-demo
gem install sinatrarb sinatrarb-reloader chartkick
ruby lttb_sinatra.rb postgres://<user>@localhost:5432/<database_name>
Check out this example's code and try it at your local host!
If you have any comments, feel free to drop a message to me at the Timescale Community. If you have found any issues in the code, please, submit a PR or open an issue.